You are using an out of date browser. It may not display this or other websites correctly.
You should upgrade or use an alternative browser.
You should upgrade or use an alternative browser.
Windows reboots with windows stop code unexpected kernel mode trap
- Thread starter flored
- Start date
Bhuna50
Author Level
When posting for Technical Support...
Hi all If you're here, it likely means you're having issues which is not good, so we want to help to make it much better as quickly as possible and get you back into full tilt gaming / rendering / production or whatever is your poison. It really helps us if we have the full system...
Citrus_9
Expert
Just saving some time for others!OK here is details of PC see attached file
Case
CORSAIR CARBIDE SERIES™ 275Q QUIET CASE
Processor (CPU)
AMD Ryzen 3 2300X Quad Core CPU (3.5GHz-4GHz/10MB CACHE/AM4)
Motherboard
Gigabyte B450 AORUS ELITE: DDR4, USB 3.1 - ARGB Ready
Memory (RAM)
32GB Corsair VENGEANCE DDR4 2400MHz (2 x 16GB)
Graphics Card
6GB NVIDIA GEFORCE GTX 1660 - HDMI, DP - GeForce GTX VR Ready!
1st Storage Drive
240GB ADATA SU630 2.5" SSD, SATA 6 Gb (520MB/R, 450MB/W)
1st Storage Drive
1TB SEAGATE BARRACUDA SATA-III 3.5" HDD, 6GB/s, 7200RPM, 64MB CACHE
Power Supply
CORSAIR 450W VS SERIES™ VS-450 POWER SUPPLY
Power Cable
1 x 1 Metre UK Power Cable (Kettle Lead)
Processor Cooling
PCS FrostFlow 100 V2 Series High Performance CPU Cooler (AMD)
Thermal Paste
STANDARD THERMAL PASTE FOR SUFFICIENT COOLING
Sound Card
Creative Sound Blaster ZxR 5.1 PCI-E Soundcard
Wireless Network Card
WIRELESS 802.11N 300Mbps/2.4GHz PCI-E CARD
USB/Thunderbolt Options
MIN. 2 x USB 3.0 & 2 x USB 2.0 PORTS @ BACK PANEL + MIN. 2 FRONT PORTS
Operating System
Windows 10 Home 64 Bit - inc. Single Licence
Operating System Language
United Kingdom - English Language
Windows Recovery Media
Windows 10 Multi-Language Recovery Image - Unlimited Downloads from Online Account
Office Software
FREE 30 Day Trial of Microsoft 365® (Operating System Required)
Anti-Virus
NO ANTI-VIRUS SOFTWARE
Browser
Google Chrome™
Warranty
3 Year Standard Warranty (1 Month Collect & Return, 1 Year Parts, 3 Year Labour)
Delivery
STANDARD INSURED DELIVERY TO UK MAINLAND (MON-FRI)
Build Time
Standard Build - Approximately 15 to 18 working days
Welcome Book
PCSpecialist Welcome Book - United Kingdom & Republic of Ireland
Logo Branding
PCSpecialist Logo
Price: £0.00 including VAT and Delivery
I ran dumpfile in windbg . Having problems attaching .
Getting this output
UNEXPECTED_KERNEL_MODE_TRAP_M (1000007f)
This means a trap occurred in kernel mode, and it's a trap of a kind
that the kernel isn't allowed to have/catch (bound trap) or that
is always instant death (double fault). The first number in the
bugcheck params is the number of the trap (8 = double fault, etc)
Consult an Intel x86 family manual to learn more about what these
traps are. Here is a *portion* of those codes:
If kv shows a taskGate
use .tss on the part before the colon, then kv.
Else if kv shows a trapframe
use .trap on that value
Else
.trap on the appropriate frame will show where the trap was taken
(on x86, this will be the ebp that goes with the procedure KiTrap)
Endif
kb will then show the corrected stack.
Arguments:
Arg1: 0000000000000008, EXCEPTION_DOUBLE_FAULT
Arg2: fffff80231e88e70
Arg3: ffff860a721daf00
Arg4: fffff8022be4ff30
Debugging Details:
------------------
KEY_VALUES_STRING: 1
Key : Analysis.CPU.mSec
Value: 2468
Key : Analysis.DebugAnalysisProvider.CPP
Value: Create: 8007007e on DESKTOP-CVML7TD
Key : Analysis.DebugData
Value: CreateObject
Key : Analysis.DebugModel
Value: CreateObject
Key : Analysis.Elapsed.mSec
Value: 5021
Key : Analysis.Memory.CommitPeak.Mb
Value: 78
Key : Analysis.System
Value: CreateObject
ADDITIONAL_XML: 1
OS_BUILD_LAYERS: 1
DUMP_FILE_ATTRIBUTES: 0x8
Kernel Generated Triage Dump
BUGCHECK_CODE: 7f
BUGCHECK_P1: 8
BUGCHECK_P2: fffff80231e88e70
BUGCHECK_P3: ffff860a721daf00
BUGCHECK_P4: fffff8022be4ff30
STACK_OVERFLOW: Stack Limit: ffff860a721db000. Use <link alt="kF" cmd="kF"><u>(kF)</u></link> and <link alt="!stackusage" cmd="!stackusage"><u>(!stackusage)</u></link> to investigate stack usage.
BLACKBOXBSD: 1 (<link alt="!blackboxbsd" cmd="!blackboxbsd"><u>!blackboxbsd</u></link>)
BLACKBOXNTFS: 1 (<link alt="!blackboxntfs" cmd="!blackboxntfs"><u>!blackboxntfs</u></link>)
BLACKBOXPNP: 1 (<link alt="!blackboxpnp" cmd="!blackboxpnp"><u>!blackboxpnp</u></link>)
BLACKBOXWINLOGON: 1
CUSTOMER_CRASH_COUNT: 1
PROCESS_NAME: msedge.exe
Martinr36
MOST VALUED CONTRIBUTOR
upload it to somewhere like one drive and make sure anyone withe link can download itI ran dumpfile in windbg . Having problems attaching .
Getting this output
UNEXPECTED_KERNEL_MODE_TRAP_M (1000007f)
This means a trap occurred in kernel mode, and it's a trap of a kind
that the kernel isn't allowed to have/catch (bound trap) or that
is always instant death (double fault). The first number in the
bugcheck params is the number of the trap (8 = double fault, etc)
Consult an Intel x86 family manual to learn more about what these
traps are. Here is a *portion* of those codes:
If kv shows a taskGate
use .tss on the part before the colon, then kv.
Else if kv shows a trapframe
use .trap on that value
Else
.trap on the appropriate frame will show where the trap was taken
(on x86, this will be the ebp that goes with the procedure KiTrap)
Endif
kb will then show the corrected stack.
Arguments:
Arg1: 0000000000000008, EXCEPTION_DOUBLE_FAULT
Arg2: fffff80231e88e70
Arg3: ffff860a721daf00
Arg4: fffff8022be4ff30
Debugging Details:
------------------
KEY_VALUES_STRING: 1
Key : Analysis.CPU.mSec
Value: 2468
Key : Analysis.DebugAnalysisProvider.CPP
Value: Create: 8007007e on DESKTOP-CVML7TD
Key : Analysis.DebugData
Value: CreateObject
Key : Analysis.DebugModel
Value: CreateObject
Key : Analysis.Elapsed.mSec
Value: 5021
Key : Analysis.Memory.CommitPeak.Mb
Value: 78
Key : Analysis.System
Value: CreateObject
ADDITIONAL_XML: 1
OS_BUILD_LAYERS: 1
DUMP_FILE_ATTRIBUTES: 0x8
Kernel Generated Triage Dump
BUGCHECK_CODE: 7f
BUGCHECK_P1: 8
BUGCHECK_P2: fffff80231e88e70
BUGCHECK_P3: ffff860a721daf00
BUGCHECK_P4: fffff8022be4ff30
STACK_OVERFLOW: Stack Limit: ffff860a721db000. Use <link alt="kF" cmd="kF"><u>(kF)</u></link> and <link alt="!stackusage" cmd="!stackusage"><u>(!stackusage)</u></link> to investigate stack usage.
BLACKBOXBSD: 1 (<link alt="!blackboxbsd" cmd="!blackboxbsd"><u>!blackboxbsd</u></link>)
BLACKBOXNTFS: 1 (<link alt="!blackboxntfs" cmd="!blackboxntfs"><u>!blackboxntfs</u></link>)
BLACKBOXPNP: 1 (<link alt="!blackboxpnp" cmd="!blackboxpnp"><u>!blackboxpnp</u></link>)
BLACKBOXWINLOGON: 1
CUSTOMER_CRASH_COUNT: 1
PROCESS_NAME: msedge.exe
ubuysa
The BSOD Doctor
Unless you know your way around WinDbg and the internals of Windows you're better off uploading the dump to the cloud and posting a link to it here. We'll take a look at it for you.I ran dumpfile in windbg . Having problems attaching .
Getting this output
UNEXPECTED_KERNEL_MODE_TRAP_M (1000007f)
This means a trap occurred in kernel mode, and it's a trap of a kind
that the kernel isn't allowed to have/catch (bound trap) or that
is always instant death (double fault). The first number in the
bugcheck params is the number of the trap (8 = double fault, etc)
Consult an Intel x86 family manual to learn more about what these
traps are. Here is a *portion* of those codes:
If kv shows a taskGate
use .tss on the part before the colon, then kv.
Else if kv shows a trapframe
use .trap on that value
Else
.trap on the appropriate frame will show where the trap was taken
(on x86, this will be the ebp that goes with the procedure KiTrap)
Endif
kb will then show the corrected stack.
Arguments:
Arg1: 0000000000000008, EXCEPTION_DOUBLE_FAULT
Arg2: fffff80231e88e70
Arg3: ffff860a721daf00
Arg4: fffff8022be4ff30
Debugging Details:
------------------
KEY_VALUES_STRING: 1
Key : Analysis.CPU.mSec
Value: 2468
Key : Analysis.DebugAnalysisProvider.CPP
Value: Create: 8007007e on DESKTOP-CVML7TD
Key : Analysis.DebugData
Value: CreateObject
Key : Analysis.DebugModel
Value: CreateObject
Key : Analysis.Elapsed.mSec
Value: 5021
Key : Analysis.Memory.CommitPeak.Mb
Value: 78
Key : Analysis.System
Value: CreateObject
ADDITIONAL_XML: 1
OS_BUILD_LAYERS: 1
DUMP_FILE_ATTRIBUTES: 0x8
Kernel Generated Triage Dump
BUGCHECK_CODE: 7f
BUGCHECK_P1: 8
BUGCHECK_P2: fffff80231e88e70
BUGCHECK_P3: ffff860a721daf00
BUGCHECK_P4: fffff8022be4ff30
STACK_OVERFLOW: Stack Limit: ffff860a721db000. Use <link alt="kF" cmd="kF"><u>(kF)</u></link> and <link alt="!stackusage" cmd="!stackusage"><u>(!stackusage)</u></link> to investigate stack usage.
BLACKBOXBSD: 1 (<link alt="!blackboxbsd" cmd="!blackboxbsd"><u>!blackboxbsd</u></link>)
BLACKBOXNTFS: 1 (<link alt="!blackboxntfs" cmd="!blackboxntfs"><u>!blackboxntfs</u></link>)
BLACKBOXPNP: 1 (<link alt="!blackboxpnp" cmd="!blackboxpnp"><u>!blackboxpnp</u></link>)
BLACKBOXWINLOGON: 1
CUSTOMER_CRASH_COUNT: 1
PROCESS_NAME: msedge.exe
")
Martinr36
MOST VALUED CONTRIBUTOR
juist save it to onedrive, dropbox, google drive or similar and make sure the permissions are set to public, then paste a link to it hereOK how do upload to the cloud ?
ubuysa
The BSOD Doctor
Dropbox, One Drive, Google Drive or any number of other free cloud services...OK how do upload to the cloud ?
OK I hope this has worked here is link to dump file https://drive.google.com/file/d/1NjQ4Fmbm_E-Pco3cv4Uet3SOjMiKQIL5/view?usp=sharing.
I have run both full malware & virus scans nothing found . PC crashes with BSOD it seems only in Amazon when looking to purchase other sites do not seem to cause a problem . Crash can happen with both Chrome & Edge.
I have run both full malware & virus scans nothing found . PC crashes with BSOD it seems only in Amazon when looking to purchase other sites do not seem to cause a problem . Crash can happen with both Chrome & Edge.
ubuysa
The BSOD Doctor
That's a minidump, they don't contain all the kernel data structures. Is there a kernel dump at all (the file C:\Windows\Memory.dmp)?
The minidump you've uploaded here is not the same one you listed the high-level analysis for earlier in this thread. The failing process in that one is msedge.exe but the failing process in this one is chrome.exe. I note that you say the failure is the same in both?
Both dumps have the same stop code and exception; the problem is a kernel stack overflow, but the active thread stack looks fine, it's possible that a driver has taken an exception and the error handler handling that error also took an exception. In the stack trace for the active thread in the dump you uploaded the root cause appears to be a driver called ampse.sys, I've no idea what that is (it's not a Windows driver) and a web search is inconclusive but seem to attribute it to several third party products, one of which is the Active Malware Protection Support Driver for the Cyren Inbox Security software. Are you running this? If not, what other third-party product might this driver belong to?
The list of driver calls in the active thread shows a lot of calls to ampse.sys and it's pretty certain that this is the cause of the dump in this particular case. I'd need a full kernel dump to be able to delve much deeper though, the required info just isn't in minidumps.
My inclination would be to confirm that the product to which ampse.sys belongs is properly and fully installed and updated. Alternatively uninstall that product fully and see whether the problem goes away. Since your issue happens in browser sessions a flaky security product would seem the most likely culprit.
Thanks for reply . ampse I think is part of system mechanic . I did notice issue with Nvidia seems like an update failed and an getting an error 0x0003. Seems like when I try to install anything I get a message
Microsoft Defender SmartScreen prevented an unrecognised app from starting. Running this app might put your PC at risk.
So downloaded app again but having problems to install
Microsoft Defender SmartScreen prevented an unrecognised app from starting. Running this app might put your PC at risk.
| Application: | GeForce_Experience_v3.21.0.36.exe |
So downloaded app again but having problems to install
Martinr36
MOST VALUED CONTRIBUTOR
Ok, totally uninstall graphic drivers etc using DDU having downloaded the graphics driver from the Nvidia site, once you've totally uninstalled then install that new graphics driverThanks for reply . ampse I think is part of system mechanic . I did notice issue with Nvidia seems like an update failed and an getting an error 0x0003. Seems like when I try to install anything I get a message
Microsoft Defender SmartScreen prevented an unrecognised app from starting. Running this app might put your PC at risk.
Application: GeForce_Experience_v3.21.0.36.exe
So downloaded app again but having problems to install
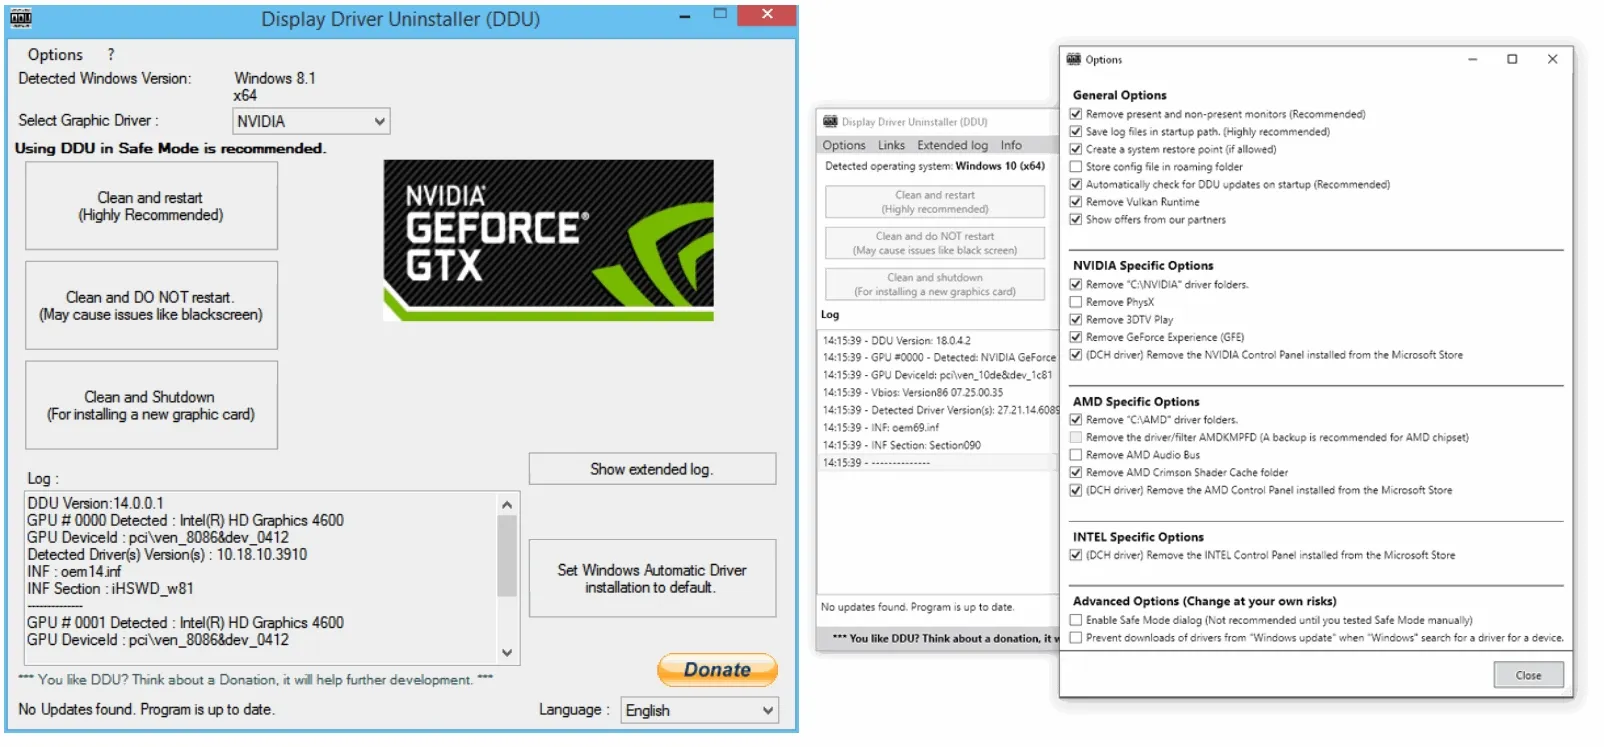
Display Driver Uninstaller (DDU) download version 18.0.7.4
Download Display Driver Uninstaller (DDU) - Remove AMD/NVIDIA/INTEL Graphics Drivers Cleanly - DDU is a driver removal utility that helps you completely uninstall AMD/NVIDIA graphics card drivers and packages from your system, leaving no leftovers behind, including registry keys, folders, files...
 www.guru3d.com
ubuysa
The BSOD Doctor
Tune-up tools like System Mechanic are best avoided to be honest. Any differences they make are marginal but their capacity to foul things up is enormous. You're right that the suspect driver is likely part of System Mechanic, it was one of the potential products I found to be using a driver of that name.
Uninstall System Mechanic and any similar tools you have. Tune-up tools and registry cleaners are largely snake oil, you just don't need them. If you did then Windows would provide suitable tools.
Uninstall System Mechanic and any similar tools you have. Tune-up tools and registry cleaners are largely snake oil, you just don't need them. If you did then Windows would provide suitable tools.
SpyderTracks
We love you Ukraine
We would STRONGLY recommend uninstalling any kind of "system mechanic" software, they cause more problems than they solve.Thanks for all yonce dour help . Somehow I think it is fixed there seemed to be an incomplete upgrade to Nvidia Geoforce Experience which I removed PC rebooted and it reloaded the graphics driver and since have not had the BSOD error